TL;DR
Problem: CSA's sales operation planned daily routes for hundreds of customer outlets manually, with no clear way to balance workload or tie daily visits to monthly KPIs.
Role: UI/UX Designer working alongside a Business Analyst and Product Manager. Led the interface design end-to-end and helped translate CSA's operational rules into configurable workflows.
Solution: A four-module portal covering route planning, sales and customer masters, plan archives, and a configurable rule engine. Built so non-technical supervisors can set rules, override routes, and see consequences live.
Outcome: Currently in development at CSA, replacing spreadsheet-based planning with a single portal where supervisors own both the routes and the logic behind them.
The Challenge
PT Catur Sentosa Adiprana runs one of Indonesia's largest building-materials distribution networks. Their sales operation covers hundreds of customer outlets across the Jakarta region, with multiple supervisor teams responsible for assigning daily routes, balancing workload, and hitting monthly visit targets.
The existing process was manual. Spreadsheets, group chats, supervisor judgment. That broke down in three predictable ways: inconsistent customer coverage, unbalanced workloads between sales reps, and no clean line between a single day's visits and the team's monthly KPIs. CSA needed a system that could plan routes intelligently, but still let supervisors override and adjust. Automation as an assistant, not a replacement.
My Role
UI/UX Designer working alongside a Business Analyst and Product Manager. I led the interface design end-to-end (information architecture, every screen flow, and the visual system). I also co-defined the optimization rules with the CSA team. The base operational rules came from CSA's existing playbook, and my job was to translate them into a configurable model that non-technical supervisors could actually use without engineering involvement.
I translated PRDs and workshop decisions into user flows, wireframes, high-fidelity screens, interactive prototypes, reusable component patterns, and developer-ready specifications for Agile delivery.
The Solution
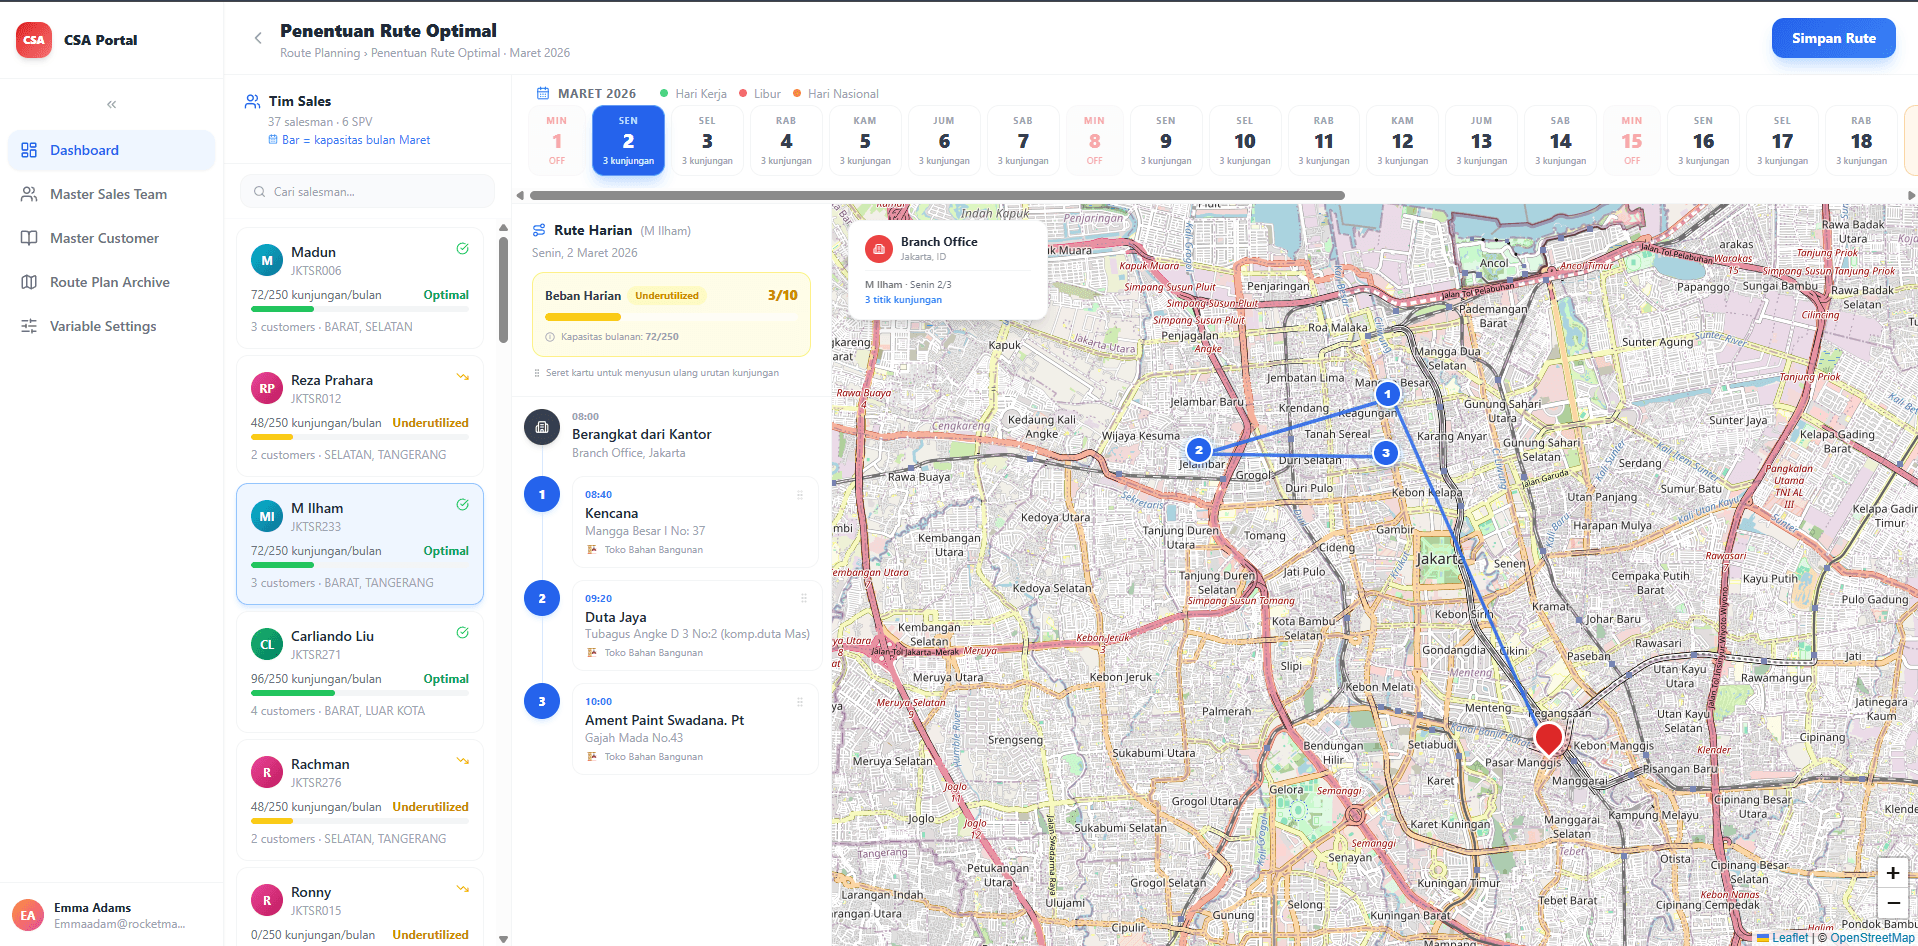
Daily Route Planning Dashboard. A three-pane planning view combining a sales team list, a calendar showing working days with daily visit counts, and a live map plotting the branch office and customer pins. Supervisors see workload balance at a glance, and can drag visit cards to reorder a day's route directly in the timeline. No separate edit screen, no modal stack.
Master Sales Team & Master Customer. Two relational data masters with grouped views (supervisors to reps), coverage area chips, product assignments, workload progress bars, and outlet segmentation. Designed for fast scanning of large record sets, with area filters and inline status indicators so supervisors don't have to drill into individual records to read team health.
Route Plan Archive. A monthly archive view showing every plan period side by side with status pills, execution progress, team coverage, and working days. Lets supervisors compare months, track completion rates, and resume in-progress plans without leaving the portal for spreadsheets.
Variable & Rule Settings. The hardest design problem in the project. A four-tab settings system (Pengaturan Umum, Prioritas Rute, Target Bulanan, Segmen & Produk) that exposes the optimization engine's parameters in plain Indonesian language. Working hours, average travel speed, max stores per day, visit duration, route algorithm priority, monthly KPIs, and segment weighting all sit on screens a supervisor can read and adjust without an engineer in the room. The Target Bulanan tab calculates total team capacity live as you type, so supervisors see the consequence of every change before they save it.
Key Design Challenges
- Designing a settings interface that exposes powerful optimization logic without overwhelming non-technical supervisors. Every field needed a one-line description in plain language. The difference between "Kecepatan Rata-Rata" sitting alone on a screen and "Perkiraan kecepatan salesman di jalan, untuk menghitung waktu tempuh" sitting underneath it is the difference between a tool people trust and a tool people abandon.
- Balancing automation with control. Supervisors trusted the system more when they could override it manually, so the planning dashboard had to support both automatic optimization and drag-and-drop reordering on the same screen.
- Making density work in a tool people use all day. Used disciplined typography, soft section dividers, and inline progress indicators instead of separate detail screens, so supervisors stay on one screen instead of bouncing between tabs.
- Showing live feedback in configuration. Instead of "save and pray," the rule settings calculate downstream impact on the fly. Total team capacity, target coverage, daily ceilings, all visible so supervisors understand the system as they configure it.
Design Outcome and Status
The portal is currently in development as part of CSA's digital-transformation initiative. The approved design brings route assignment, workload balancing, customer and sales masters, configurable rules, and KPI visibility into one connected experience for the Jakarta sales operation.
Because the product has not completed rollout, this case study does not claim post-launch efficiency gains. Its verified outcome is an implementation-ready interface and workflow model that gives operations teams direct control over rules that previously depended on spreadsheets and manual coordination.
What I Learned
Enterprise tools live or die on the settings screen. You can design the prettiest dashboard in the world, but if the people configuring the rules can't understand what each toggle does, the whole system collapses into "just use the defaults." Plain-language labels, inline math, and visible consequences turned what could have been a developer-only admin panel into something a supervisor can own.
That same principle, making complex logic legible to non-technical users, is exactly what investment platforms need when they ask everyday people to set risk profiles, recurring deposits, and portfolio rules.